Cancergraph is designed, developed and maintained by Malecare, Inc., the men’s cancer survivor support and advocacy nonprofit organization.
Doctors want to know how their patients experience symptoms and side effects so they can optimize treatments and therapies. But patients are unreliable in recalling their symptoms and side effects. During the doctor visit, patients literally have minutes to verbally describe how their disease and therapies have affected their lives during the previous three or four months.
Patients can’t remember specific days, times or severities for symptoms, emotions and side effects. It’s impossible. Memories are easily lost and patients actually want to forget times of distress and pain.
Patients experience their symptoms and side effects during the day, night, while lost on the way to the bathroom, and while crying themselves to sleep. Few patients have the desire or discipline to maintain a written diary and even fewer have the stamina or desire to enter their symptom instances on online forms.
There are very few symptoms that are recordable independent of the patient. Some biometric data can be recorded using wearable instruments. But most symptoms and side effects are agnostic to electronic monitors. Symptoms like pain, dizziness, urinary and fecal continence, skin rashes and itching and emotions like anxiety, sadness and anger all require the patient’s subjective assessment of severity for each instance.
Patient reported outcomes (PRO) forms and measures of distress are impossible to use by patients at the time that they are experiencing their distress. Ten point scales (is my pain level a 7 or an 8???), smiley face scales, scales using text or images and colors from green to red are unable to be broadly understood by patients from a variety of races, cultures, genders and sexual identities. And, PRO forms filled out in doctors waiting rooms are rarely.
Getting useful histories and rigorous data requires patient input within hours or minutes of each symptom and side effect. It also requires that the patient understands what they are inputting.
Patients must have a powerful and compelling desire to regularly and rigorously use a symptom reporting tool. Cancergraph is that tool. Cancergraph helps doctors suggest more appropriate treatments and helps patients feel more confident that their treatment is being tailored for their actual experience.
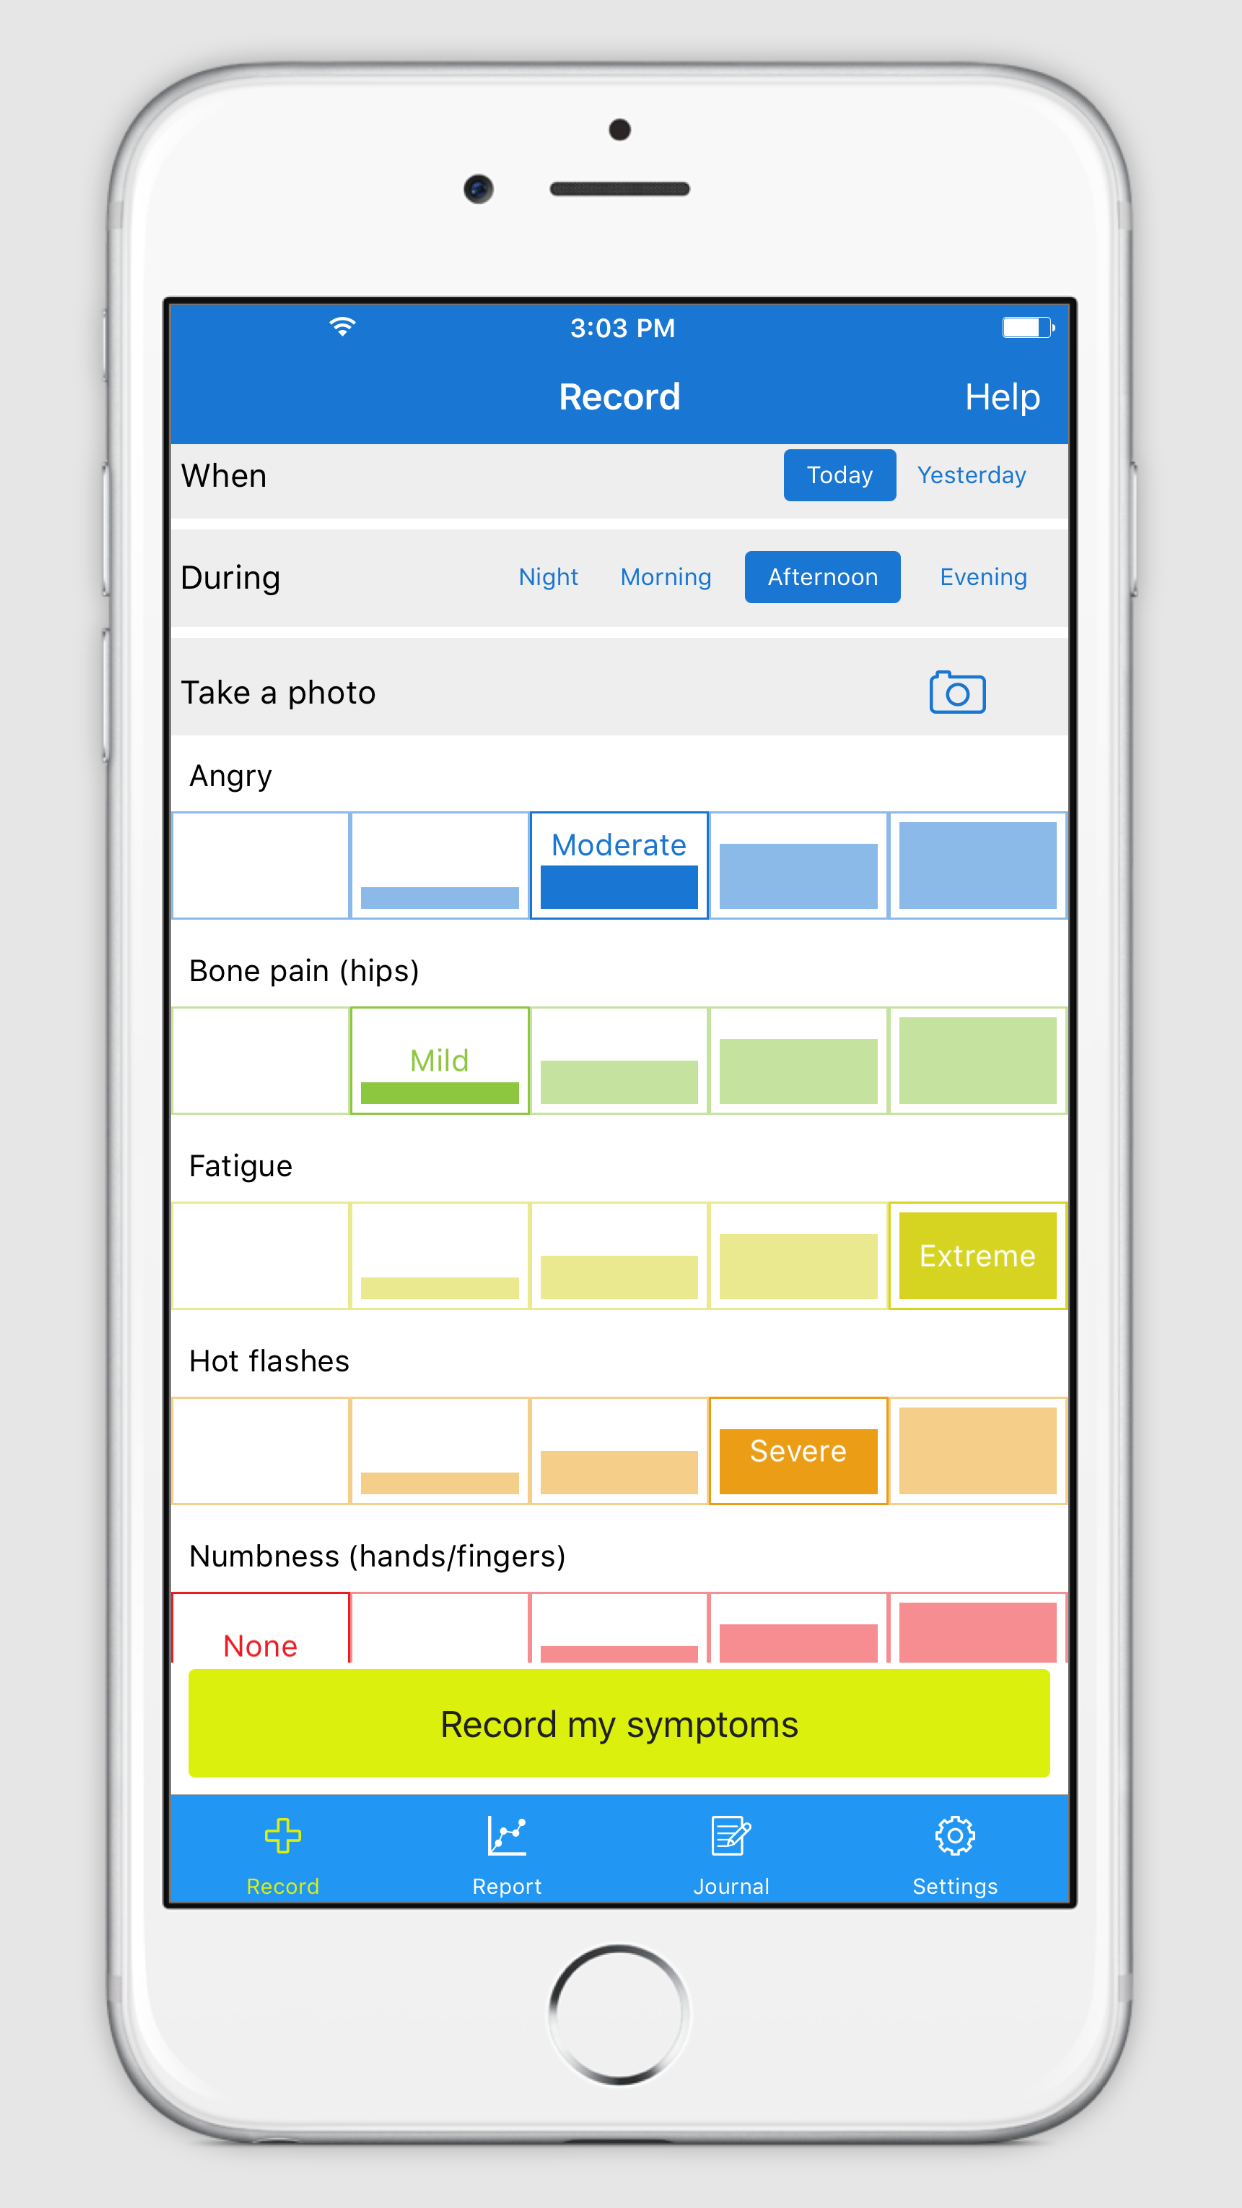
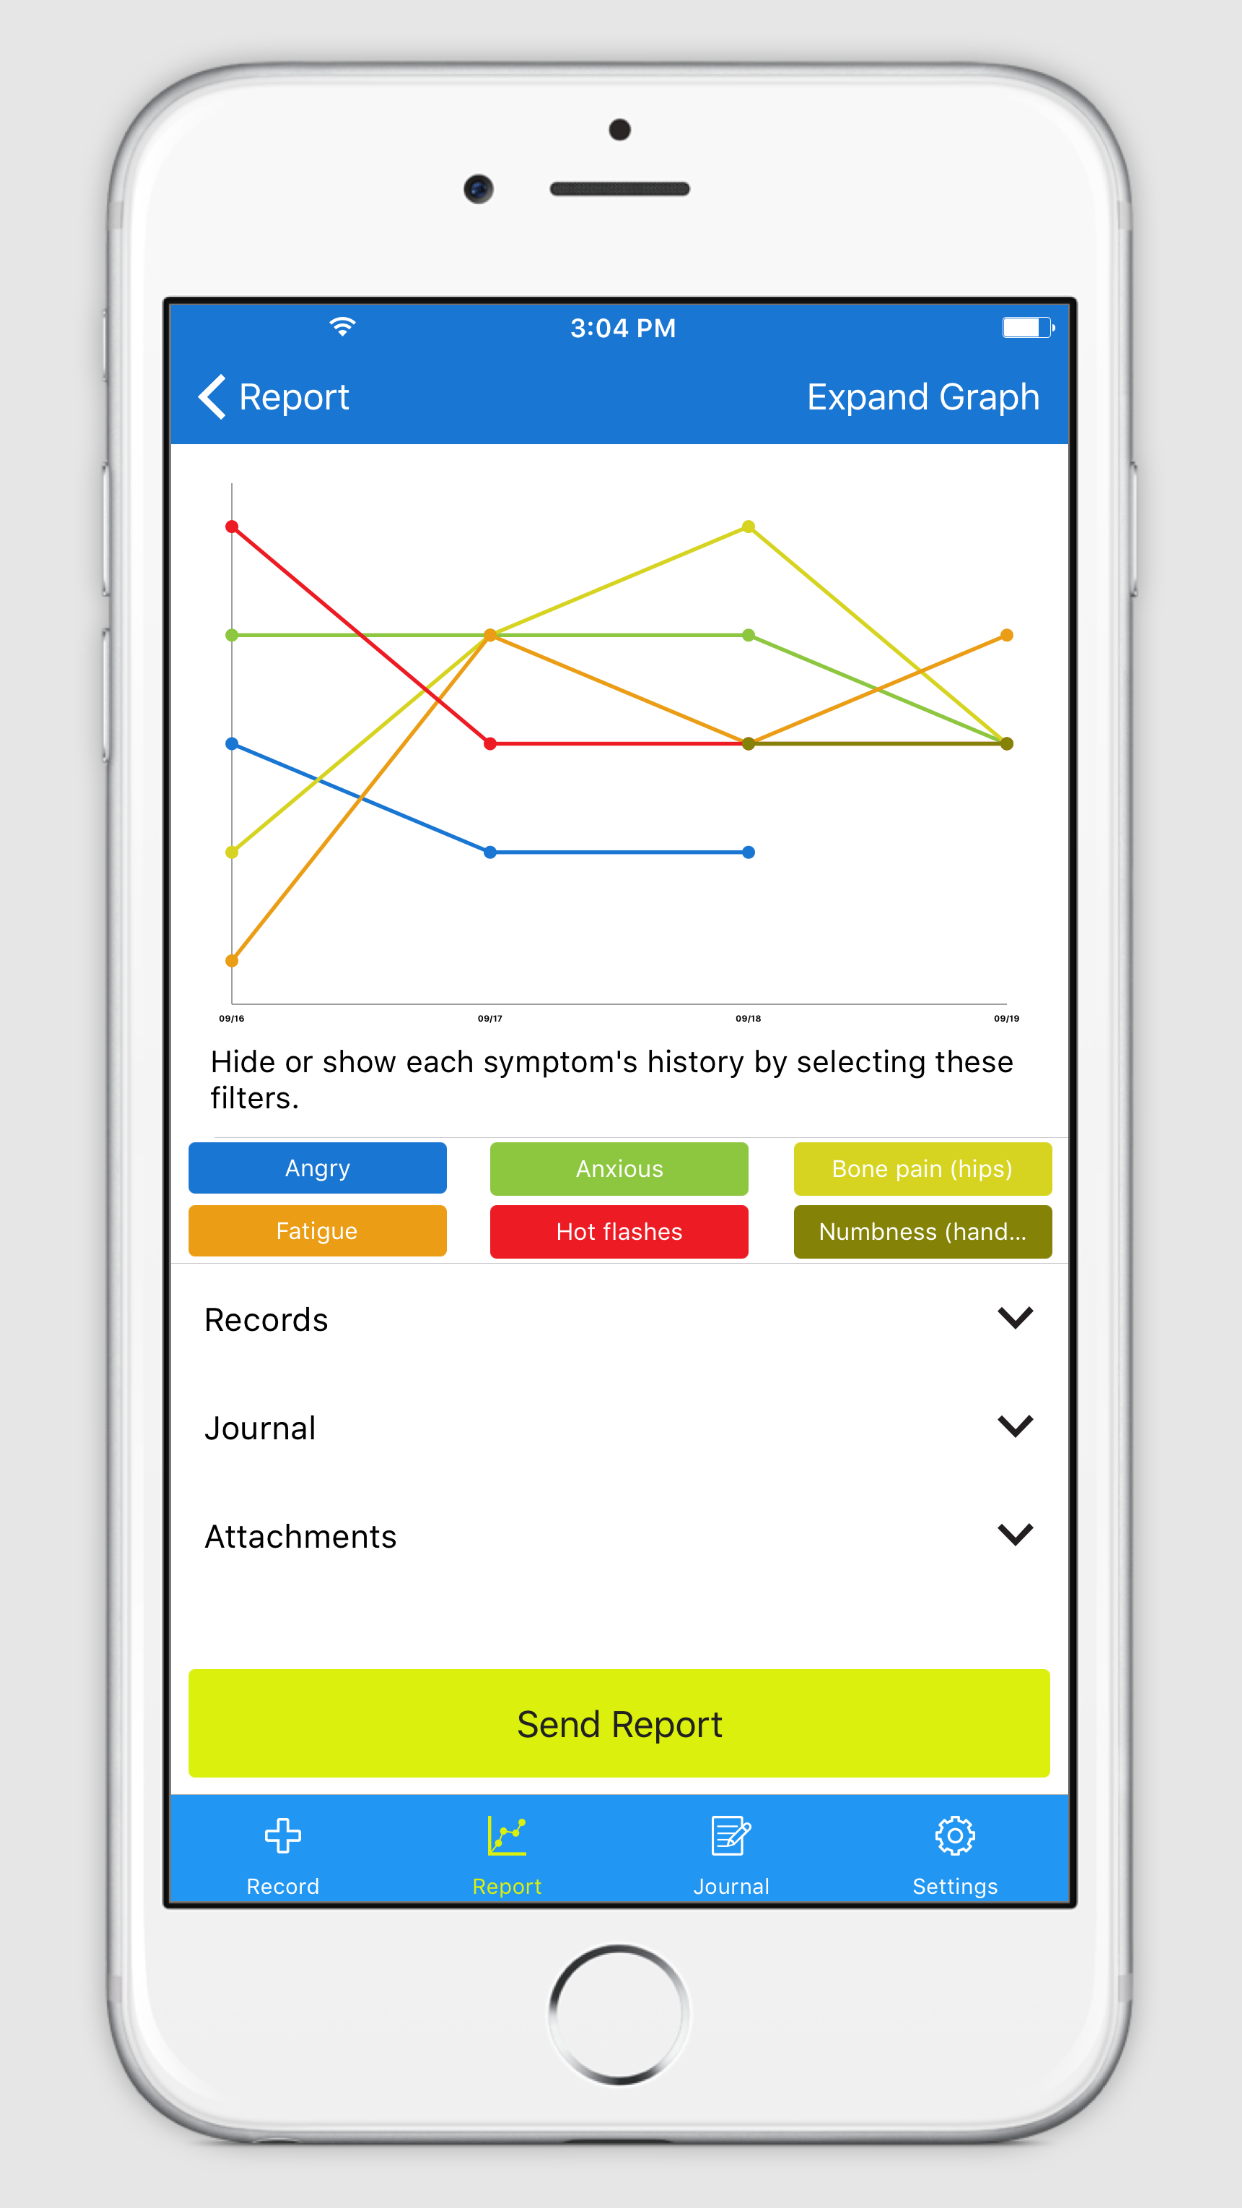
Patients instantly understand and are able to use Cancergraph…and most all want to use Cancergraph, every day. Patients say they love building the graphs and seeing how their symptoms match and vary over time.
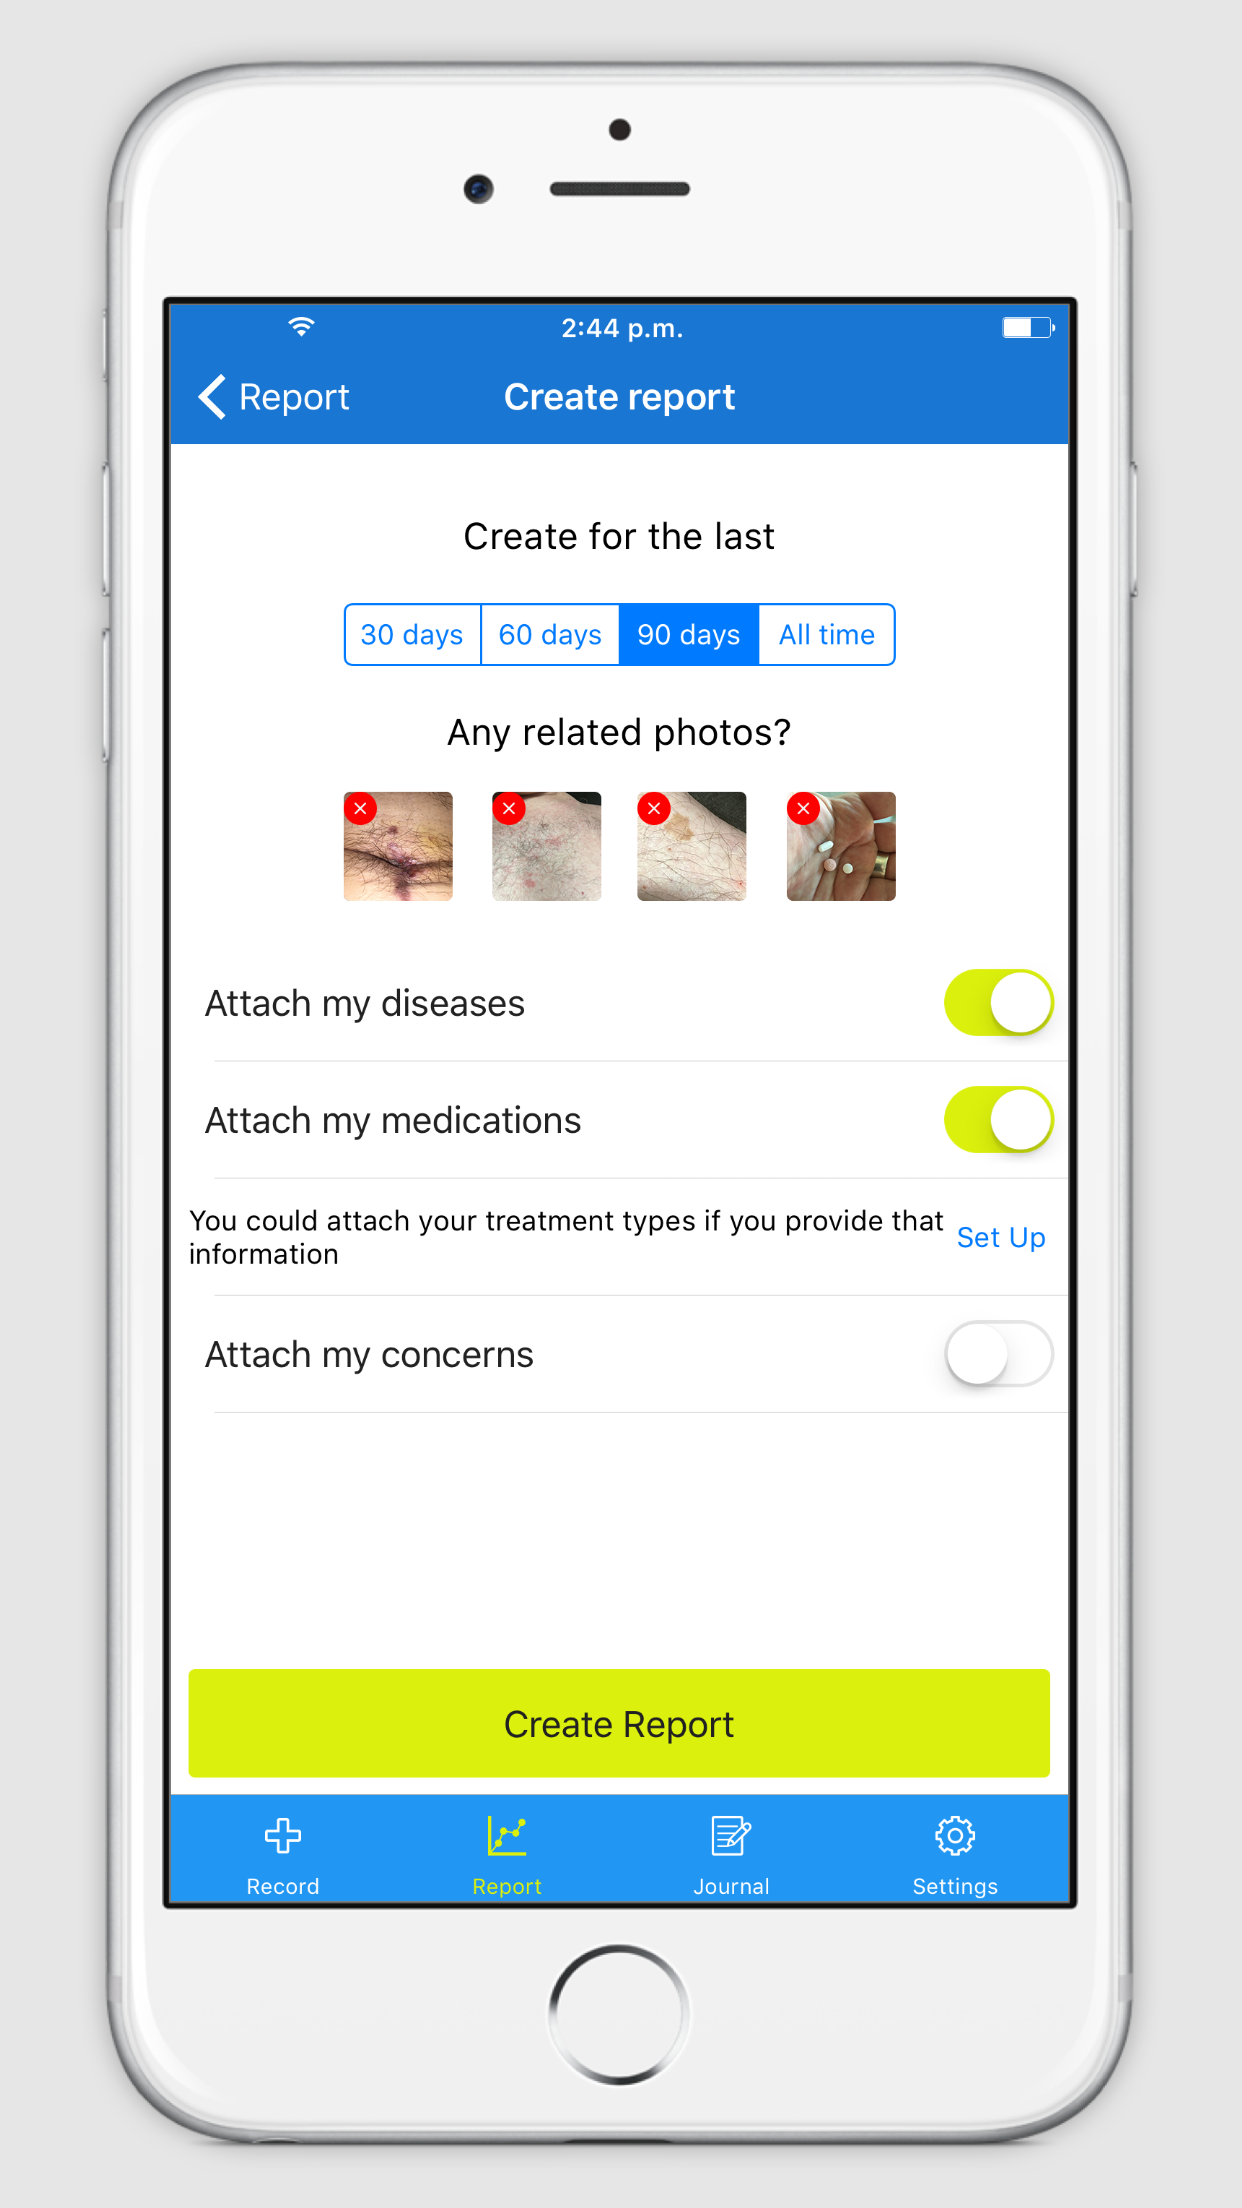
Patients have the option to include as much or as little about themselves as they wish. Patients choose from a list of over 200 symptoms and side effects, and have the option to include their cancer types, medications, concerns and other diseases and morbidities, all for use in research. They can even sign up for clinical trial opportunities that match their cancer and disease profiles.
Patients can also take photos of rashes, skin cancers, discolored stool…anything that is easier to show than describe. Cancergraph creates a secure photo storage area on the phone, so patient’s feces photos do not show up next to their vacation photos.
Cancergraph also has a journal feature, so patients can write text when they want to share more than a few words about how they are feeling.
Cancergraph enjoyable user interface encourages patients to input their experience even if they are feeling OK…that’s great data to have, too.
In background, Cancergraph distills the inputted data into a beautiful report that the patient can view on their phone, print out as a pdf or email to their doctor.
Cancergraph is a beautiful, stress reducing distributed memory tool that gives patients and doctors reliable reports about day to day patient experiences.
Cancergraph.
Designed by patients and caregivers, for patients and caregivers.
